


Blog: Art-Kubed
Navigating traffic commutes and Microservices by putting data in the driver’s seatNavigating traffic commutes and Microservices by putting data in the driver’s seat
Navigating traffic commutes and Microservices by putting data in the driver’s seat
It is hard to imagine life without a product like Google Maps when going anywhere these days. While the idea of whipping out a paper map from the glove compartment and navigating by the stars sounds adventurous and ought to be tried when on holiday, a handy assistant like Google Maps at the tip of your fingers (or your voice) can’t be beaten when getting from Point A to Point B. The data science involved in sourcing live traffic data from a myriad collection of sources, coupled with the right context like current location, topographical features, toll data, and specific historical user preferences, processing these data in real time to then presenting a choice of actionable navigation recommendations, solves a ubiquitous need to get to one’s destination of choice with an elegant solution.

Hark back to the times before Google Maps, when we had to rely on the good old and badly updated SatNav systems coupled with more poorly updated paper maps and no live traffic data or context. Correlating the data from these different silos of information and guessing an optimal route would undoubtedly rely on the driver’s experience and previous knowledge of all the traffic routes. Sigh, all of us can’t have the legendary “tribal knowledge” of London cabbies all the time.
Enter into the arena of cloud native environments, where there are similar challenges that Dev, Platform, and Ops teams face when navigating the ever growing and highly complex traffic maps of Microservices depending on each other, with dependencies overflowing into underlying Kubernetes component layers, and cloud infrastructure layers.
All of us can’t have the legendary “tribal knowledge” of London cabbies all the time
The amount of operational data generated by Microservices and their tech stacks like Kubernetes is ever increasing as teams and organizations grow and continue to scale their apps. This scale of data has gone beyond the capacity of individual developers and teams to wrangle and visualize manually, relative to previous versions of their applications that used to be monoliths and their architecture could be drawn simply from memory on a whiteboard by a single developer (and it would be right!).
Characteristics of Microservices data and why it is different
As application architectures evolve towards cloud-native Microservices, it is not just the scale of the data size but also the types of operational data that need to be observed by cloud-native teams that are evolving.
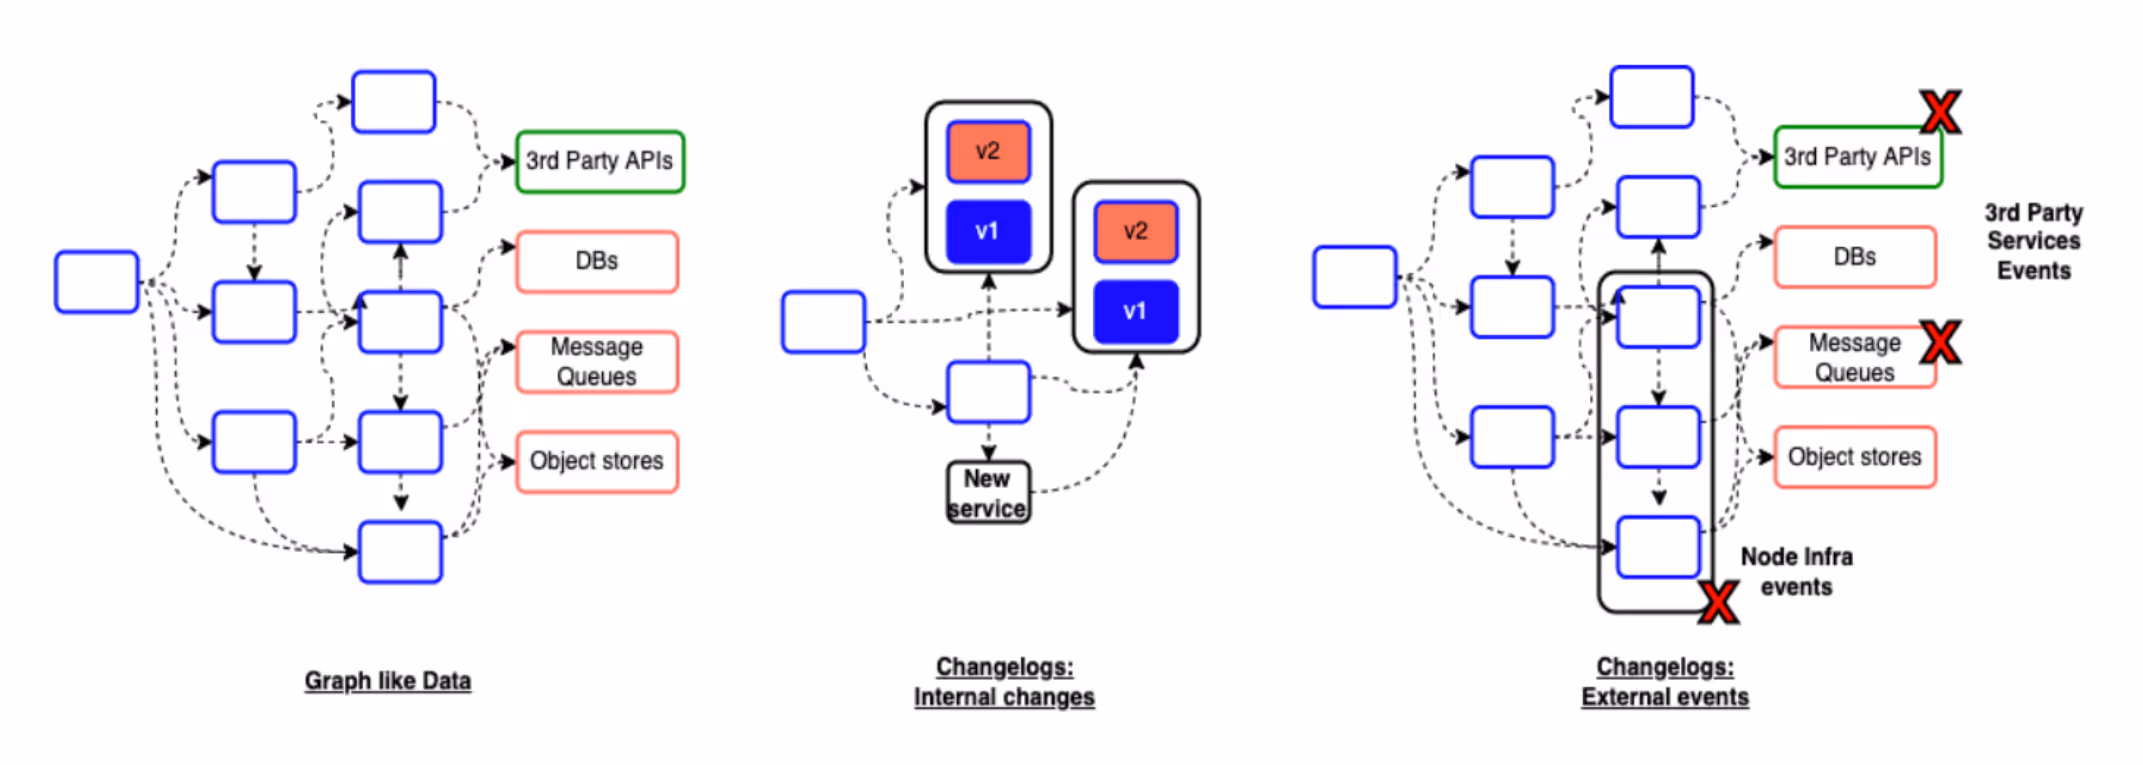
Microservices data looks like a graph
Microservices end up depending on each other to implement end to end application features. These dependencies are amongst internally developed services as well as external 3rd party APIs and service providers.
When teams think about performance, failure characteristics, data flow costs, and overall security of their Microservices based applications, understanding their service architecture as a graph of inter-related dependencies is important, as operational features of one microservice will inevitably affect operations of other services, thereby impacting end to end features and goals. Similar to constantly changing traffic maps of busy cities, this graph-like data model is highly dynamic as service dependencies and the underlying infrastructure dependencies evolve over time, so having a continuously updated view into the latest state of the graph is important.
Similar to constantly changing traffic maps of busy cities, this graph-like data model is highly dynamic
Graph based relationships go beyond Microservices to the teams that own them. Thinking of Microservices as an interconnected graph helps organizations understand the service ownership dependencies amongst teams which is important when planning and working together to meet organizational objectives around reliability, availability, costs and security of their apps, or when troubleshooting outages.
Microservices data is change and events-driven
With a growing shift to cloud native development, changes to Microservices happen often and incrementally, compared to bigger and less frequent changes in monoliths. As a Microservice developer, it is important to be aware of changes like service updates (both code and configuration updates) happening not only for the service their team owns, but also for services that their service depends on.
Changes are often the most cited reason behind outages, so having a contextual view into changes and their timelines that matter to a service is important not only when dealing with outages, but also during engineering planning and daily operations. Understanding holistic change timelines proactively can help in adapting to changes in a more progressive and resilient manner while reducing the likelihood of outages that they could otherwise cause.
Just like time of the day and other events impact a driver’s journey in real time traffic, there are other data streams beyond internal service updates like external events that could impact a service’s operations. Nodes hosting services could go down, 3rd party APIs and 3rd party services like database providers that services depend on could fail. While having visibility into these external isolated event data streams is a good start, the more important need is to be able to correlate across different data streams and derive contextual insights into how these events could impact a service’s operations over time.
Microservices data is heterogeneous
There is a proliferation of data types and data sources within Microservices data ranging from external event data structures, Microservice configurations within tech stacks like Kubernetes, to Kubernetes events, traffic metrics derived from service meshes or 3rd party tools, and so on.
In order to understand how events at the Kubernetes or cloud infrastructure layers or other Microservice dependencies like internal and 3rd party APIs could impact the daily operations of Microservice applications, teams have to integrate with multiple diverse API sources to fetch the right data - including cloud provider APIs, Kubernetes APIs, Prometheus or other metrics store APIs, followed by building the right data models, data pipelines and queries at a holistic level that generate the right insights - this could take months of time and investment.
As organizations evolve and move towards cloud native technologies like Kubernetes and Microservices from monolithic applications, ownership of platform and application services across teams is evolving to being distributed as well. Achieving broader organizational goals can no longer rely on merely reactive loops that locally break-fix application behavior only in the event of outages. Teams today want proactive insights when understanding their Microservices and service ownership dependencies, analyzing their Microservices performance and resilience so that fewer outages happen, adopting best practices for security and authorization that are customized to their data and apps, and understanding and optimizing their cloud cost expenditure customized to their usage. Inherently, all of these problems are data problems which need data-driven solutions that take into account the fundamentally different nature of Microservices data of being highly connected, distributed, constantly changing, event-driven and heterogeneous, and turn these data into actionable insights without the manual toil.
Stating this problem in a different context, teams are looking for solutions that help them navigate the complex maze of Microservices data strategically with automated insights and actions as they plan to get to their desired goals - doesn’t this sound remarkably similar to the problem of navigating real-life traffic needing a data-driven solution like Google Maps that provides automatic traffic insights and recommended routes while eliminating the manual toil of having to synthesize data from disparate sources to guess an optimal route? It is time for data to be in the driver’s seat when operating Microservices as well.

.avif)