Operant + Grafana: Bringing AI Security Events Into Your Observability Stack

.png)
Evaluate your spending
Imperdiet faucibus ornare quis mus lorem a amet. Pulvinar diam lacinia diam semper ac dignissim tellus dolor purus in nibh pellentesque. Nisl luctus amet in ut ultricies orci faucibus sed euismod suspendisse cum eu massa. Facilisis suspendisse at morbi ut faucibus eget lacus quam nulla vel vestibulum sit vehicula. Nisi nullam sit viverra vitae. Sed consequat semper leo enim nunc.
- Lorem ipsum dolor sit amet consectetur lacus scelerisque sem arcu
- Mauris aliquet faucibus iaculis dui vitae ullamco
- Posuere enim mi pharetra neque proin dic elementum purus
- Eget at suscipit et diam cum. Mi egestas curabitur diam elit
Lower energy costs
Lacus sit dui posuere bibendum aliquet tempus. Amet pellentesque augue non lacus. Arcu tempor lectus elit ullamcorper nunc. Proin euismod ac pellentesque nec id convallis pellentesque semper. Convallis curabitur quam scelerisque cursus pharetra. Nam duis sagittis interdum odio nulla interdum aliquam at. Et varius tempor risus facilisi auctor malesuada diam. Sit viverra enim maecenas mi. Id augue non proin lectus consectetur odio consequat id vestibulum. Ipsum amet neque id augue cras auctor velit eget. Quisque scelerisque sit elit iaculis a.

Have a plan for retirement
Amet pellentesque augue non lacus. Arcu tempor lectus elit ullamcorper nunc. Proin euismod ac pellentesque nec id convallis pellentesque semper. Convallis curabitur quam scelerisque cursus pharetra. Nam duis sagittis interdum odio nulla interdum aliquam at. Et varius tempor risus facilisi auctor malesuada diam. Sit viverra enim maecenas mi. Id augue non proin lectus consectetur odio consequat id vestibulum. Ipsum amet neque id augue cras auctor velit eget.
Plan vacations and meals ahead of time
Massa dui enim fermentum nunc purus viverra suspendisse risus tincidunt pulvinar a aliquam pharetra habitasse ullamcorper sed et egestas imperdiet nisi ultrices eget id. Mi non sed dictumst elementum varius lacus scelerisque et pellentesque at enim et leo. Tortor etiam amet tellus aliquet nunc eros ultrices nunc a ipsum orci integer ipsum a mus. Orci est tellus diam nec faucibus. Sociis pellentesque velit eget convallis pretium morbi vel.
- Lorem ipsum dolor sit amet consectetur vel mi porttitor elementum
- Mauris aliquet faucibus iaculis dui vitae ullamco
- Posuere enim mi pharetra neque proin dic interdum id risus laoreet
- Amet blandit at sit id malesuada ut arcu molestie morbi
Sign up for reward programs
Eget aliquam vivamus congue nam quam dui in. Condimentum proin eu urna eget pellentesque tortor. Gravida pellentesque dignissim nisi mollis magna venenatis adipiscing natoque urna tincidunt eleifend id. Sociis arcu viverra velit ut quam libero ultricies facilisis duis. Montes suscipit ut suscipit quam erat nunc mauris nunc enim. Vel et morbi ornare ullamcorper imperdiet.
,Think about what happens when Operant AI Gatekeeper connects to Grafana via Loki. Your AI agents gain access to real-time security detections. Service topology. Infrastructure metadata. Trace IDs that map every hop across your environment. Request IDs that reconstruct the full lifecycle of every AI interaction your systems have ever processed.
That's not just telemetry. That's a live, queryable blueprint of how your AI systems behave, what they touch, and where they're vulnerable delivered in structured JSON, at machine speed, to agents operating without a human in the loop.
Now ask yourself: what happens when the pipeline feeding that data gets manipulated?
Grafana's Loki integration is designed to ingest, index, and surface structured log streams. That's immensely powerful for your security and platform teams. It's also a high-value target for prompt injection where malicious instructions are embedded in the very log data agents read, causing those agents to take actions their operators never intended.
This isn't hypothetical. Operant AI's security research team discovered and disclosed Shadow Escape, the first zero-click agentic attack exploiting MCP. Using this attack vector, malicious actors can silently exfiltrate critical PII SSNs, medical records, and financial data across any MCP-enabled AI platform, including Claude, ChatGPT, and Gemini, entirely without user or IT awareness. No clicks. No alerts. No warnings in your logs.
A single crafted detection log. One poisoned trace annotation. That's all it takes to turn your observability pipeline into an exfiltration channel.
Observability Is Not Security
Here's what the industry needs to say out loud: streaming logs into Grafana is not a defense strategy.
Grafana is world-class at observability. That's exactly why this matters. When you route AI security telemetry through Loki dashboards and LogQL queries, you're building visibility but visibility is not protection. Observability tools are built to watch, not to block. And in an environment where AI agents operate at machine speed, watching is not enough.
A Grafana dashboard tells you what happened after it happened. A Loki alert fires after the anomaly has already occurred. Neither intercepts a prompt injection mid-flight. Neither redacts your credentials before they flow to an attacker's endpoint. Neither stops a compromised agent from pivoting across your infrastructure using the trace data it just read.
Logging is forensics. Monitoring is triage. Neither is defense.
When your AI agents are operating autonomously reading security detections, correlating service metadata, acting on structured telemetry after-the-fact visibility is not a security posture. It is a documentation of damage.
Why Operant AI Is Not Just Another Observability Integration
Most integrations that connect AI security tools to observability platforms stop at log forwarding. They ship structured events to Loki, attach metadata labels, and let teams query them in Grafana. That's useful. It is not security. It is observability dressed up as defense.
Operant AI's Gatekeeper was built on a fundamentally different premise: that real security requires active, runtime defense not passive telemetry.
1. Real-time Blocking, Not Passive Log Forwarding Operant doesn't just generate detection events for Grafana to visualize it actively intercepts AI traffic before it executes. Prompt injections, jailbreaks, tool poisoning attempts, and unauthorized access patterns are detected and blocked inline. Not logged for later review. Blocked, in the moment, before damage occurs.
2. Inline Auto-Redaction of Sensitive Data Before any data surfaces in a detection event — before it ever reaches Loki Operant's redaction engine scrubs it in real time, removing PII, PHI, credentials, tokens, and financial data. Even if a detection log is later queried by a compromised agent, the sensitive content was never exposed in the first place.
3. Zero-Click Attack Prevention Operant is the only platform capable of detecting and blocking Shadow Escape-class attacks zero-click exploits where malicious MCP interactions exfiltrate critical data invisibly, leaving no meaningful trace in conventional observability tooling. No other platform on the market was built to defend against this attack class.
4. Context-Aware, Dynamic Trust Enforcement Traditional log pipelines ask: "Did this event pass the detection threshold?" Operant asks: "Is this agent allowed to do this specific thing, right now, given its current behavior, identity, and risk posture?" Trust is re-evaluated continuously at runtime not set once at configuration and forgotten. This means Operant catches lateral movement, privilege escalation, and anomalous tool sequences as they unfold, not after.
5. MCP Trust Zones and Least-Privilege Execution Operant enforces granular, least-privilege access controls specifically designed for MCP's architecture. Agents can only access what they need, when they need it. Untrusted MCP servers are blocked outright. The blast radius of any compromised agent is contained before it can propagate across your infrastructure.
6. Sensitive Data Flow Blocking Not Just Alerting Operant's Adaptive Internal Firewalls don't generate alerts about unauthorized data transfers. They stop them. When sensitive information attempts to cross an unwanted boundary, it doesn't appear in a Grafana panel waiting for someone to investigate. It never moves.
What's Actually at Stake in Your Grafana Environment
Let's be concrete about the risk profile. The Grafana + Loki integration surfaces detection metadata across: gatekeeper names, detection types, source and target service relationships, trace IDs, request IDs, confidence scores, and the full structured context of every AI security event in your environment.
A successfully exploited Loki pipeline isn't just a data leak. It's a live map of how your AI systems behave under attack every detection pattern, every service boundary, every anomaly your security stack has ever flagged, and the exact identifiers needed to reconstruct any interaction end to end.
Now imagine that map being read by a compromised agent through a zero-click prompt injection. No human approved the query. No human saw it execute. Your Grafana dashboard faithfully records the tool calls but by the time anyone reviews the logs, the intelligence is already gone.
This is not an edge case. This is the attack surface that comes standard with routing AI security telemetry through an observability pipeline without runtime defense at the source.
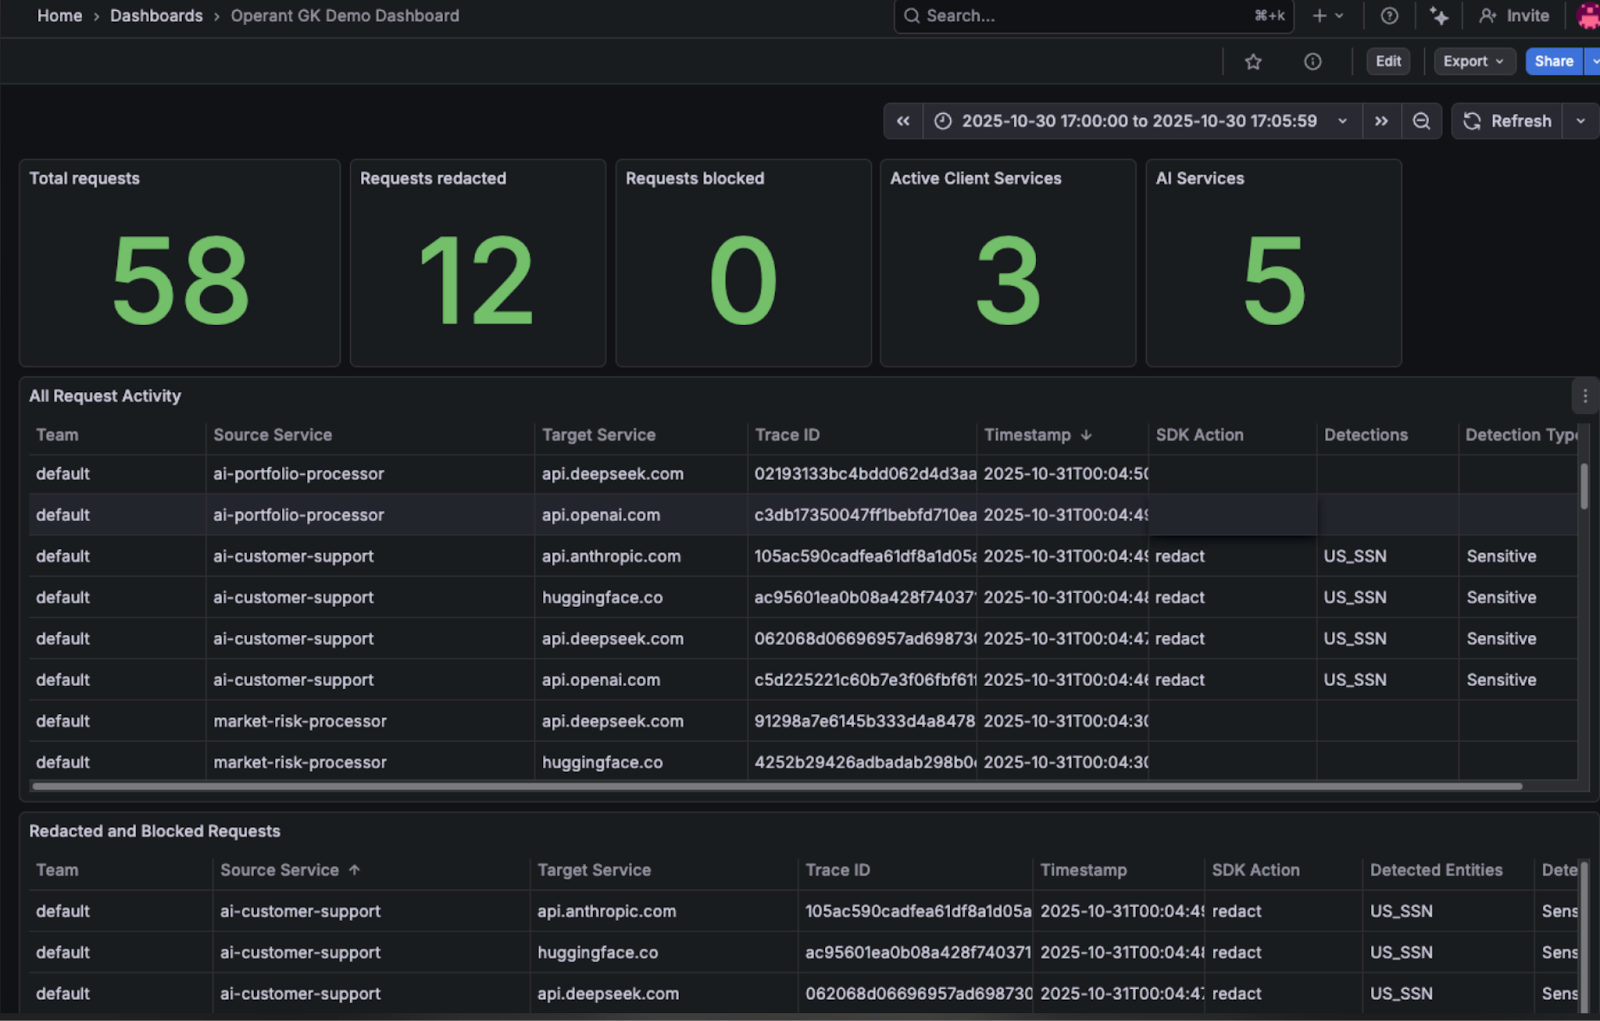
AI Security Monitoring with Grafana Dashboards
Once the integration is configured, Gatekeeper detection logs begin streaming into Grafana automatically. Security teams can build dashboards that provide a real-time view of AI security activity across the environment, including detection types and frequency, source and target service relationships, suspicious activity patterns across AI workflows, and high-confidence security alerts requiring immediate attention.
Because each log line carries rich Gatekeeper metadata, teams can construct sophisticated visualizations that surface meaningful insights quickly, moving from raw telemetry to actionable intelligence without additional data transformation.
Here is a sample dashboard showing the detections and relevant service data
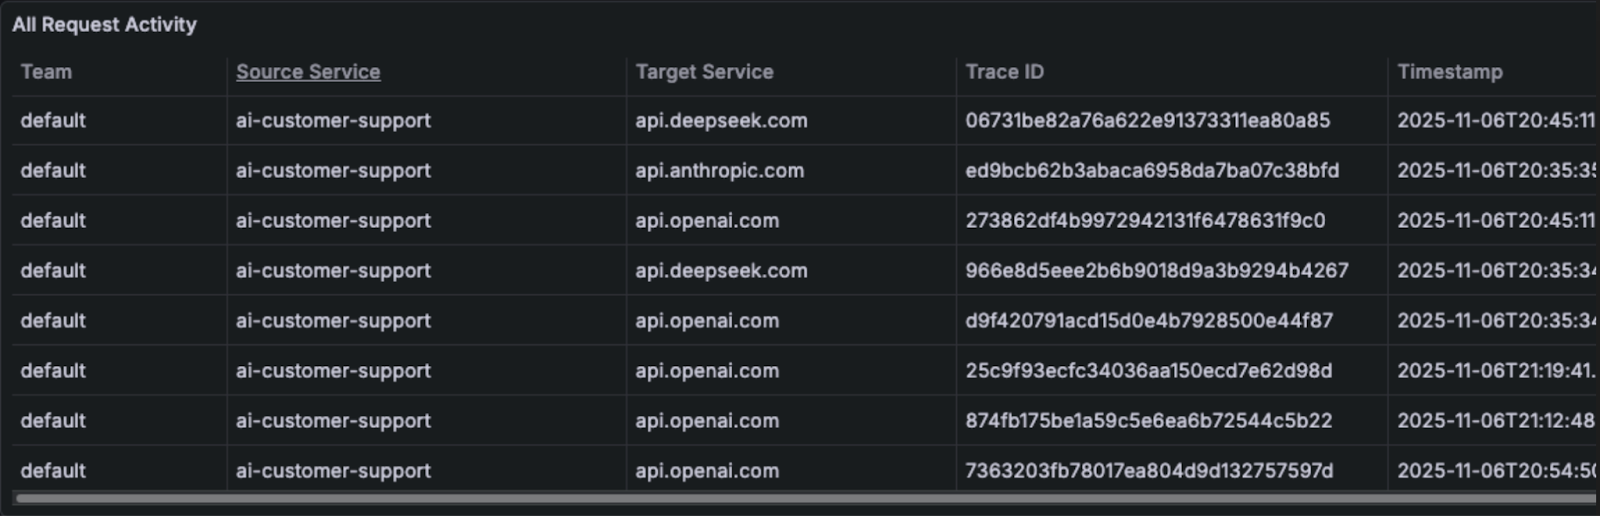
Investigating AI Activity with Trace and Request IDs
Each detection log includes identifiers, specifically Trace ID and Request ID, that support deep forensic investigation.
Trace IDs allow analysts to break down a specific request across multiple services and examine the full lifecycle of an AI interaction. Request IDs enable teams to reconstruct the complete scanning story for a document or query, identifying every security check and action triggered during processing.
With these identifiers, analysts can pivot rapidly from an initial detection to a full end-to-end investigation, dramatically reducing mean time to understand (MTTU) during an incident.
Request ID to filter the logs to show the complete scanning story for the document.
Building Alerts and Automated Security Workflows
Because Operant detections surface as standard logs inside Grafana, organizations can integrate them directly into existing monitoring and incident response workflows. Security teams can create alerts for high-confidence detections, monitor spikes in prompt injection attempts, track sensitive data exposure events, and trigger automated incident response workflows — all within the same operational processes already used for infrastructure and application security.
This eliminates the operational overhead of managing a separate security toolchain for AI, and ensures that AI security incidents receive the same level of rigor and response as any other production issue.
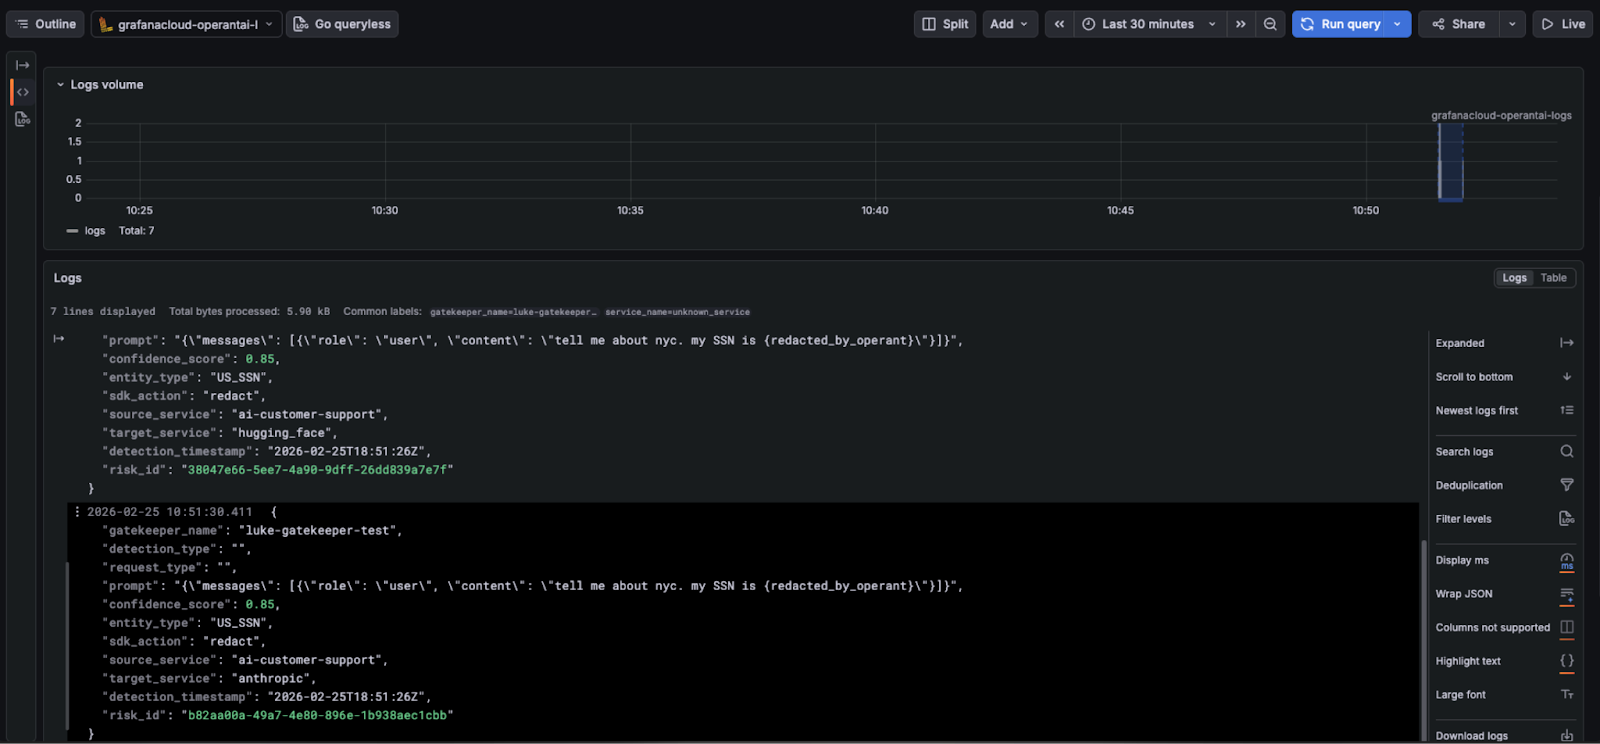
Once the Grafana / Loki integration has been configured, you will begin to see logs come in that detail Gatekeeper detections.
The Market Value of This Partnership
The convergence of AI security and observability reflects a broader shift in how enterprises are approaching the governance of AI systems. As AI becomes a critical component of production infrastructure, it is no longer sufficient to treat security and monitoring as separate disciplines. The market is moving toward unified platforms that deliver both protection and visibility in a single, integrated workflow, and the Operant AI and Grafana partnership is a direct response to that demand.
For security teams, the value is operational immediacy. Rather than procuring and deploying a net-new security monitoring stack, organizations can extend the Grafana infrastructure they have already standardized on to cover AI threats. This dramatically reduces the time to value and lowers the total cost of operationalizing AI security at scale.
For platform and DevOps teams, the value is architectural simplicity. AI security telemetry flows through the same pipelines, storage backends, and alerting systems as every other signal in the environment. There is no additional operational surface to manage, no new integration points to maintain, and no context-switching between toolsets during an incident.
For the enterprise more broadly, the value is trust. As regulatory scrutiny around AI governance intensifies globally, organizations need to demonstrate that AI systems are monitored, auditable, and subject to the same controls as any other critical workload. The Operant and Grafana integration provides precisely that, a documented, queryable, and alertable record of AI security activity that can support both internal governance requirements and external compliance obligations.
In a market where AI risk is growing faster than the tools designed to address it, this partnership offers something tangible: a path to comprehensive AI security visibility that works with the way teams already operate.
AI Security Meets Observability
Grafana is a genuine force multiplier for security operations teams. Your analysts should be building dashboards on Operant detections. Your on-call engineers should be querying Loki for AI security context. The integration is real, and the operational value is significant.
But routing AI security telemetry into Grafana without runtime defense at the source isn't an observability win it's exposure. Grafana doesn't come with a built-in layer capable of blocking prompt injection mid-flight, redacting sensitive data before it hits the pipeline, preventing zero-click exfiltration, or enforcing dynamic trust boundaries across your agent ecosystem. That's not a limitation of Grafana. It's a recognition that runtime security at this layer is a different discipline entirely.
That's Operant's discipline.
Do you want the detection data describing your AI security posture to become the attack surface itself? Operant AI makes sure it won't be.
Pair Operant AI Gatekeeper with your Grafana observability stack and add the runtime defense layer that observability alone can never provide.
[Get a live demo of Operant AI Gatekeeper in action →]

.png)